Last week I attended the 5th Data Analytics Summit at Harrisburg University of Science and Technology. I wanted to share some quick take aways from the sessions that I took notes on. Please check out their site for more info on presenters and alternative tracks. I hear they will be posting some recordings soon.
Morning Keynote: “Analytics Enablement through Robotic & Intelligent Automation (R&IA)”
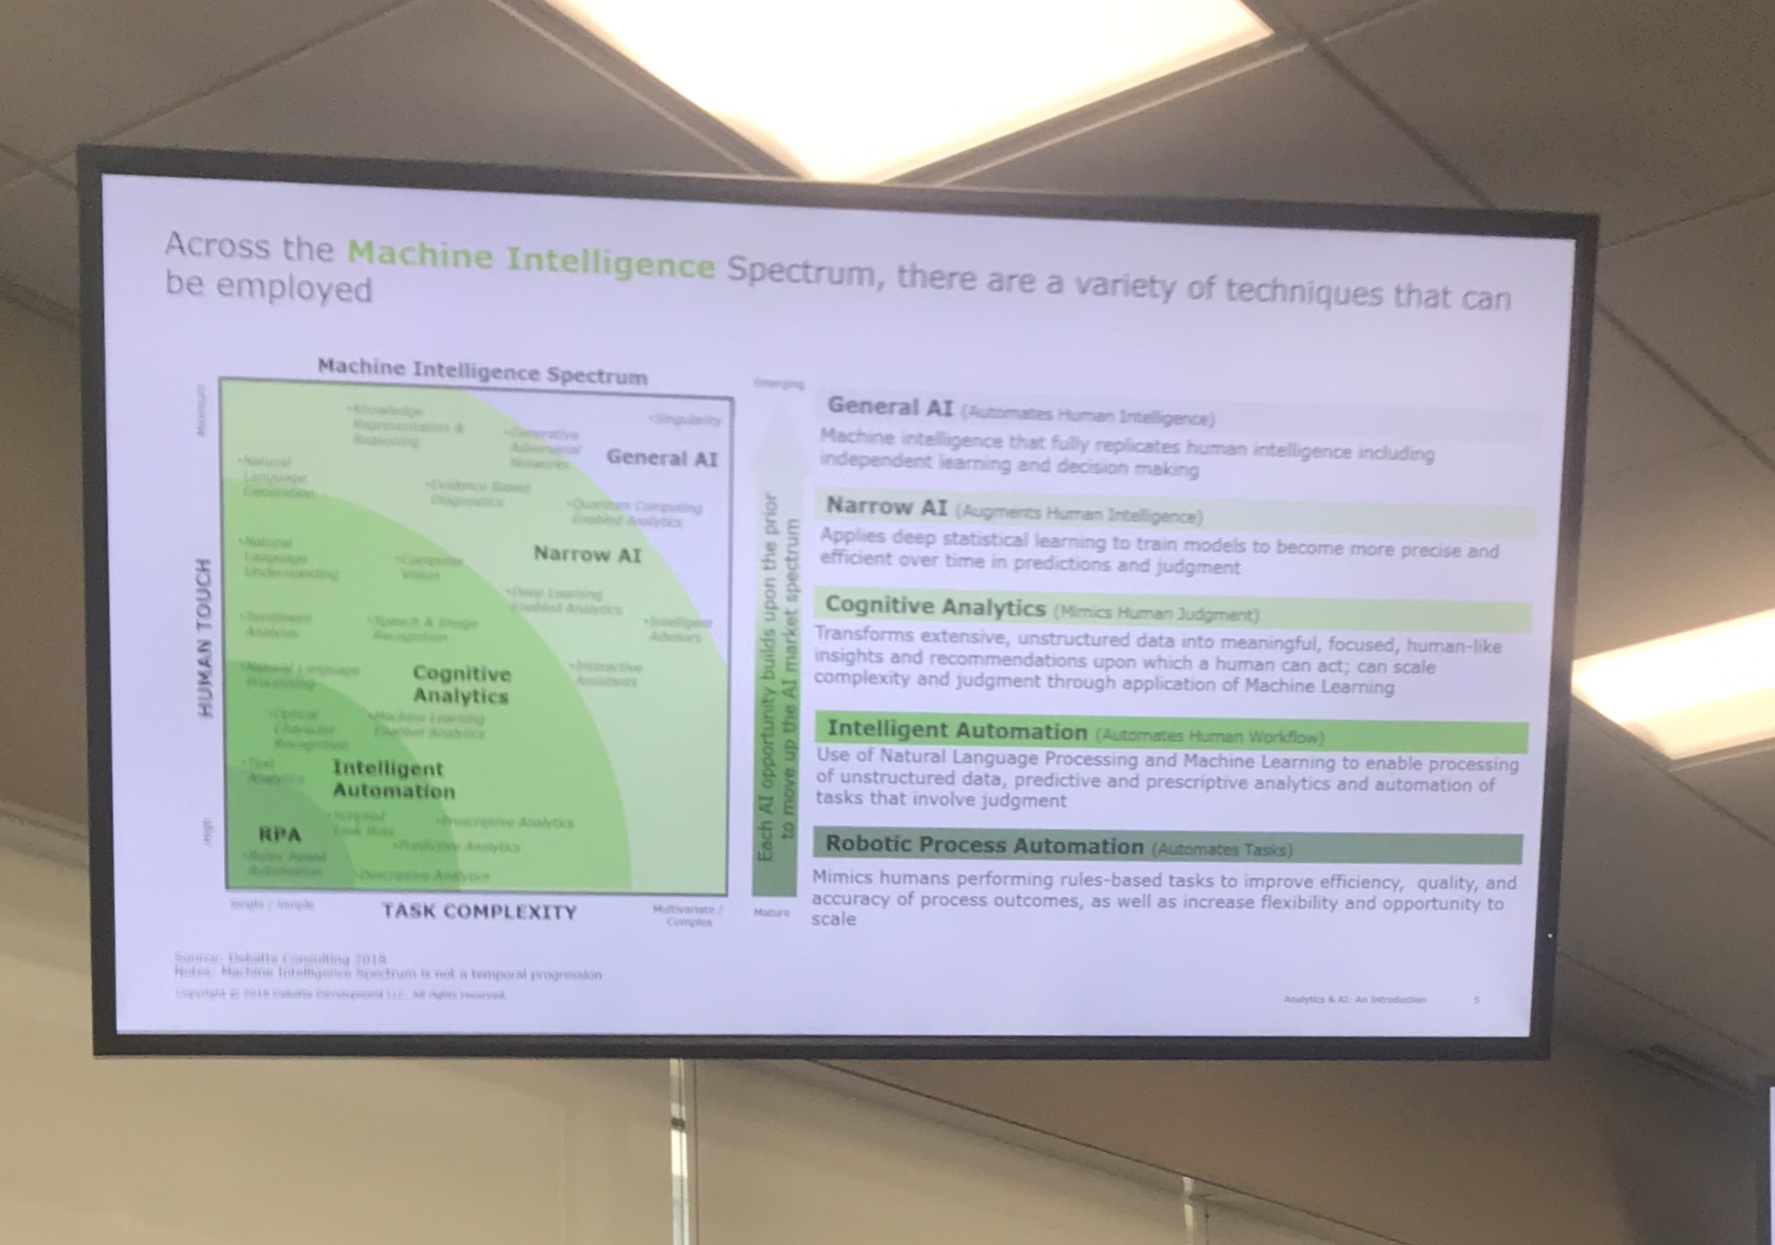
Current state of Robotics and its role in collecting/making sense of volumes of data (Autonomous Intelligence)
Robotics add a new “persona” to the workforce, 24/7
It’s important to equate time savings to dollars - make sure there is a business case
Behavioral Economics: combining AI and “nudges” to prompt behaviors for better outcomes.
Example: New Mexico Unemployment office had learned they paid out nearly $10M in ineligible benefits. They changed the experience (via wording) on questionnaires.
For example, "Do you receive any income?”. Many people are afraid to answer this truthfully. When they added "40% answer yes to this question)”, they found that many more reported what they were indeed earning while on unemployment.
“Governor Wolf’s Commitment to Using Data to Deliver Government that Works”

2017 - opening of Office for Data and Technology
Platform - data.pa.gov. 11 data sets in 2016, today 1,000, all useful
Focus on strategic growth, not just acquiring volumes
Partnering with those who want to share their data
One place that links to many
Useful for entities such as local government, communities, enterprise
More governance needed the more data we collect / share
Lean teaches us to go see and get qualitative data

Lean teaches us to go see and get qualitative data
“Got Data? – Visualize It!”. - Basic Design Principles
Design, Encode - Human Readable
Edward Tufte principles - focused on two main ones:
Data Ink Ratio - non-erasable core of a graphic (reduce visual complexity)
Chart Junk - Removing anything unnecessary, even if it looks “cool” or fun.

He (Tufte) puts forward the following 5 principles related to data ink :
1. Above all else show data.
2. Maximize the data-ink ratio.
3. Erase non-data-ink.
4. Erase redundant data-ink.
5. Revise and edit
“Graphs as Explanatory Records of Complex Real-World Activity”
Understanding behavior by analyzing structure. Experimental prototyping
Example: tracking bad guys due to connections among attributes that they could connect and visualize to raise suspects
Graphs are not charts

"Data Analytics in the Cloud – Using Technology to Help Communities Combat Homelessness"
“Redundancy” (my note) - the idea that when a person needs to access records from where their registered address is, but they may have been displaced for a variety of reasons. Today this is a huge problem that contributes to homelessness cycle. In their solution (Data Lake), this person could access a form of identification from anywhere.
This inspired me to think about application to health records
AWS shared a cool way of problem solving.
They write a Press Release and an FAQ for each feature they want to develop.
This is only for internal usage and product development.
Then, they work on how to get there, based on what they want to be saying about it publicly when it’s done.
Tools:
Amazon Comprehend Medical (Extract information from unstructured medical text accurately and quickly No machine learning experience required)
Amazon SageMaker (Machine learning for every developer and data scientist.)
Amazon QuickSight (First BI Service with Pay-per-Session Pricing and ML Insights for everyone.)
The event inspired me to:
Look for more data sources for my current line of work
Play with data visualization tools
Share some new tools with those on my team / others who are more technical than I
Re-read Edward Tufte, perhaps attend a workshop
Rediscover the problems to be solved in order to better define solutions