Simple ranking.
Our customers asked if there was a better way to find markets to invest in. So, we created one.

Overview
In order for customers to make decisions on which markets to potentially invest in, our team built a product to help customer use criteria to find suitable markets quickly. This integrated with our existing flagship product, where users could analyze selected markets of interest in our Healthcare Analytics SaaS experience.
I led the design from the beginning to launch for this product, which also included the transformation from our initial market assessment platform into a suite of products.
Process
Discovery Goals
Using our customer journey hypothesis, I designed a storyboard for the entire workflow of the problem we were looking to solve, and validated it with several of our customers directly. We had some initial discoveries we want to uncover, while making sure the journey was accurate and demonstrating how this new product could potentially redefine daily work.
How does this regional assessment, and subsequent sub-market analysis play into their workflow?
Discovering exactly which insights where needed to compare markets for decision making; what supporting info might be needed and how to present it?
How to allow users to define a goal which would alter the way calculations presented the markets of opportunity. For example, a customer interested in growing their business would select a goal simply called “Grow and Expand”. We needed to pinpoint key use cases for templating and algorithms.
What output is needed for our users’ customers? In what format do they need to see this opportunity presented as? How will it be used?
After a few years of building and servicing our flagship product for Pivotal Analytics, it became clear that some features we thought were important in the original experience were an entirely different part of our user’s workflow. It was time to create more focused experiences that helped our customers focus on these separate but related problems they were tasked with solving on a regular basis for their customers.
Findings
Goals
Present an easy-to-understand rank of submarkets within a selected region.
Understand why sub-markets score the way they do.
Select sub-markets of interest for detailed analysis.
Customer Concept Validation and Findings

Storyboard Workflow Validation
We confirmed that:
The detailed analysis of markets within a region were still needed within our flagship product, but they always followed finding a sub market of interest.
What customers ultimately tried to look for was a sort of standardized way to compare submarkets to one another in order to optimize time spent analyzing markets that might meet their goals. A simple way to compare submarkets without going too deep into analysis was the most important take away.
Customers already used real estate tools to identify real estate, so similar mapping tools were a familiar starting point to identifying and providing context around markets.
Customers agreed there were some ways that could standardize certain frequent “goals”, or things they looked for in submarkets often. Two stood out across our conversations; general growth and meeting disparities.
Insights needed to make decisions on markets to focus on:
Market share
Care gap
Growth projections
Social Determinants of Health
Projected Profitability. Possibly by service type
Payor Mix - how is healthcare being paid for?
"Example [of output]: No hospitals in this market"
Additional Challenges
Need to normalize sub-market sizes in terms of population and care gaps. Comparing a 1M people market with a 150K market. Example: Full Time Equivalent asset per capita
Deciding whether this solution could be integrated into our flagship product or be a stand alone tool that connects at the right point(s) in the workflow.
Creating a simple set of algorithms that are useful enough to most users before we build in the capability for users to change weights of variables for desired outputs.
Solution
We ultimately decided on building this tool separately from our more in-depth market assessment tool, while providing integration for users to select markets they were interested in and pull them directly in.
Our users had specific goals in mind when they determined markets of interest. We provided algorithms that assigned weights to different levels of variables which were disclosed when the user wanted them, but did not get in the way of a simple experience of few clicks to get to their regional assessment. The list of goals are planned to grow and evolve with feedback, and eventually allow users to toggle weights in the algorithm themselves.
For example, a customer interested in growing their business would select a goal simply called “Grow and Expand”.
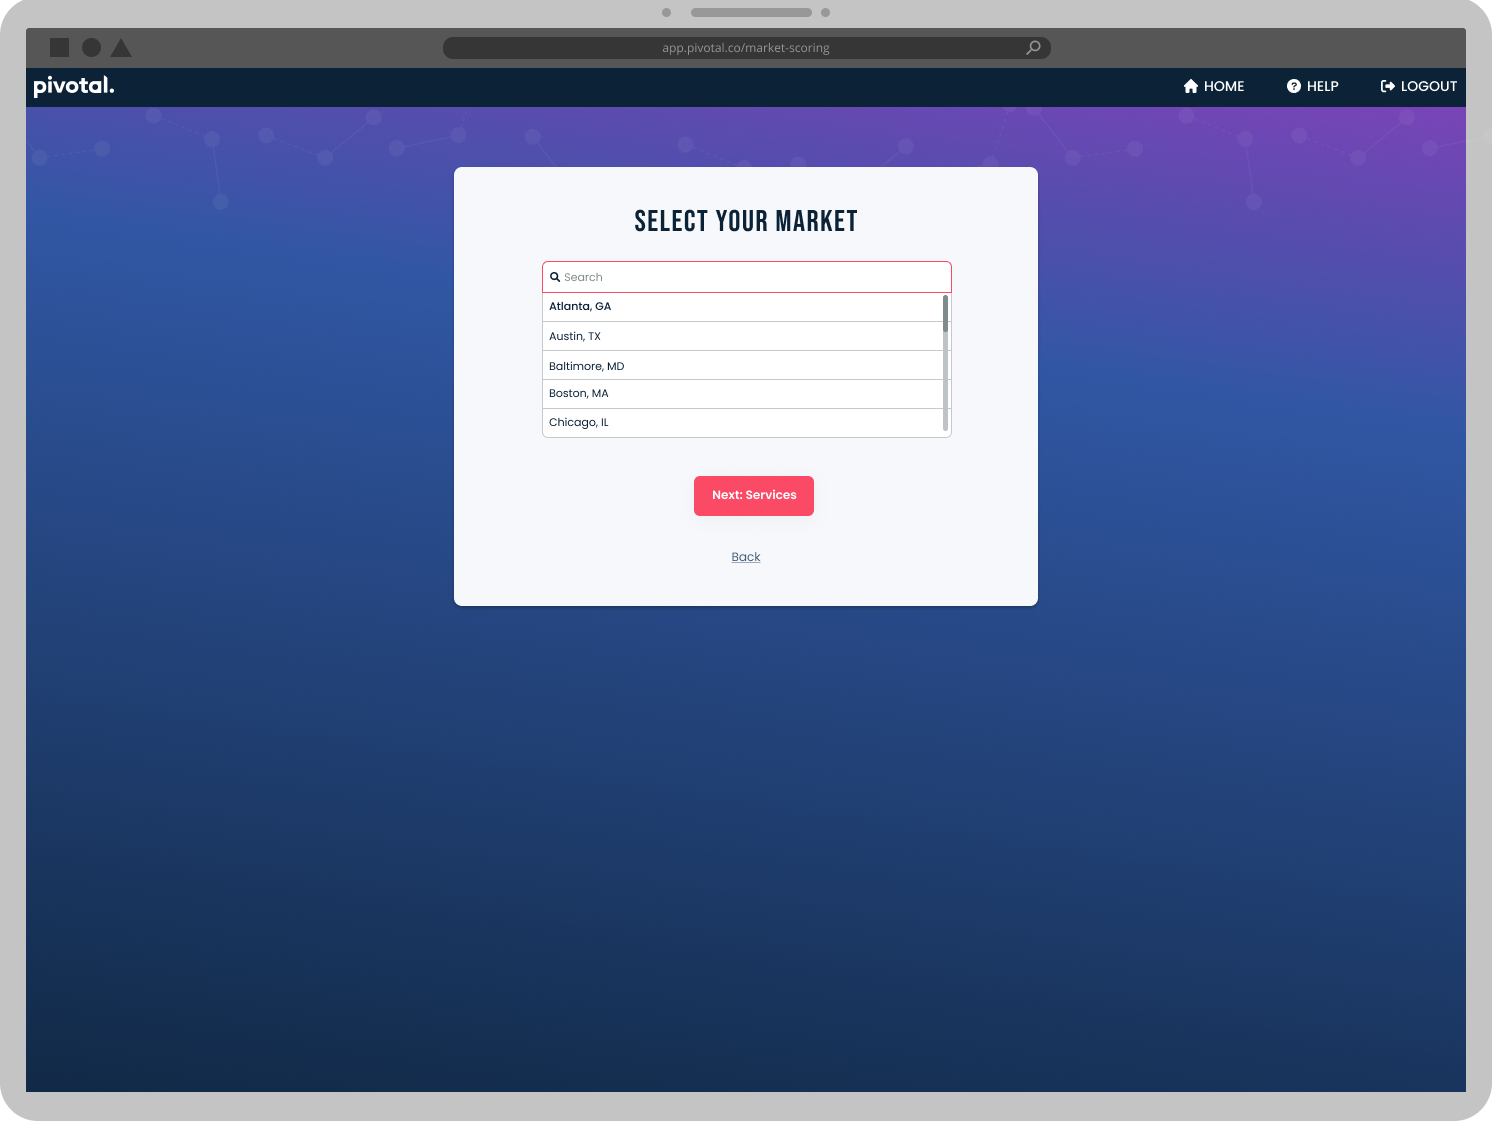
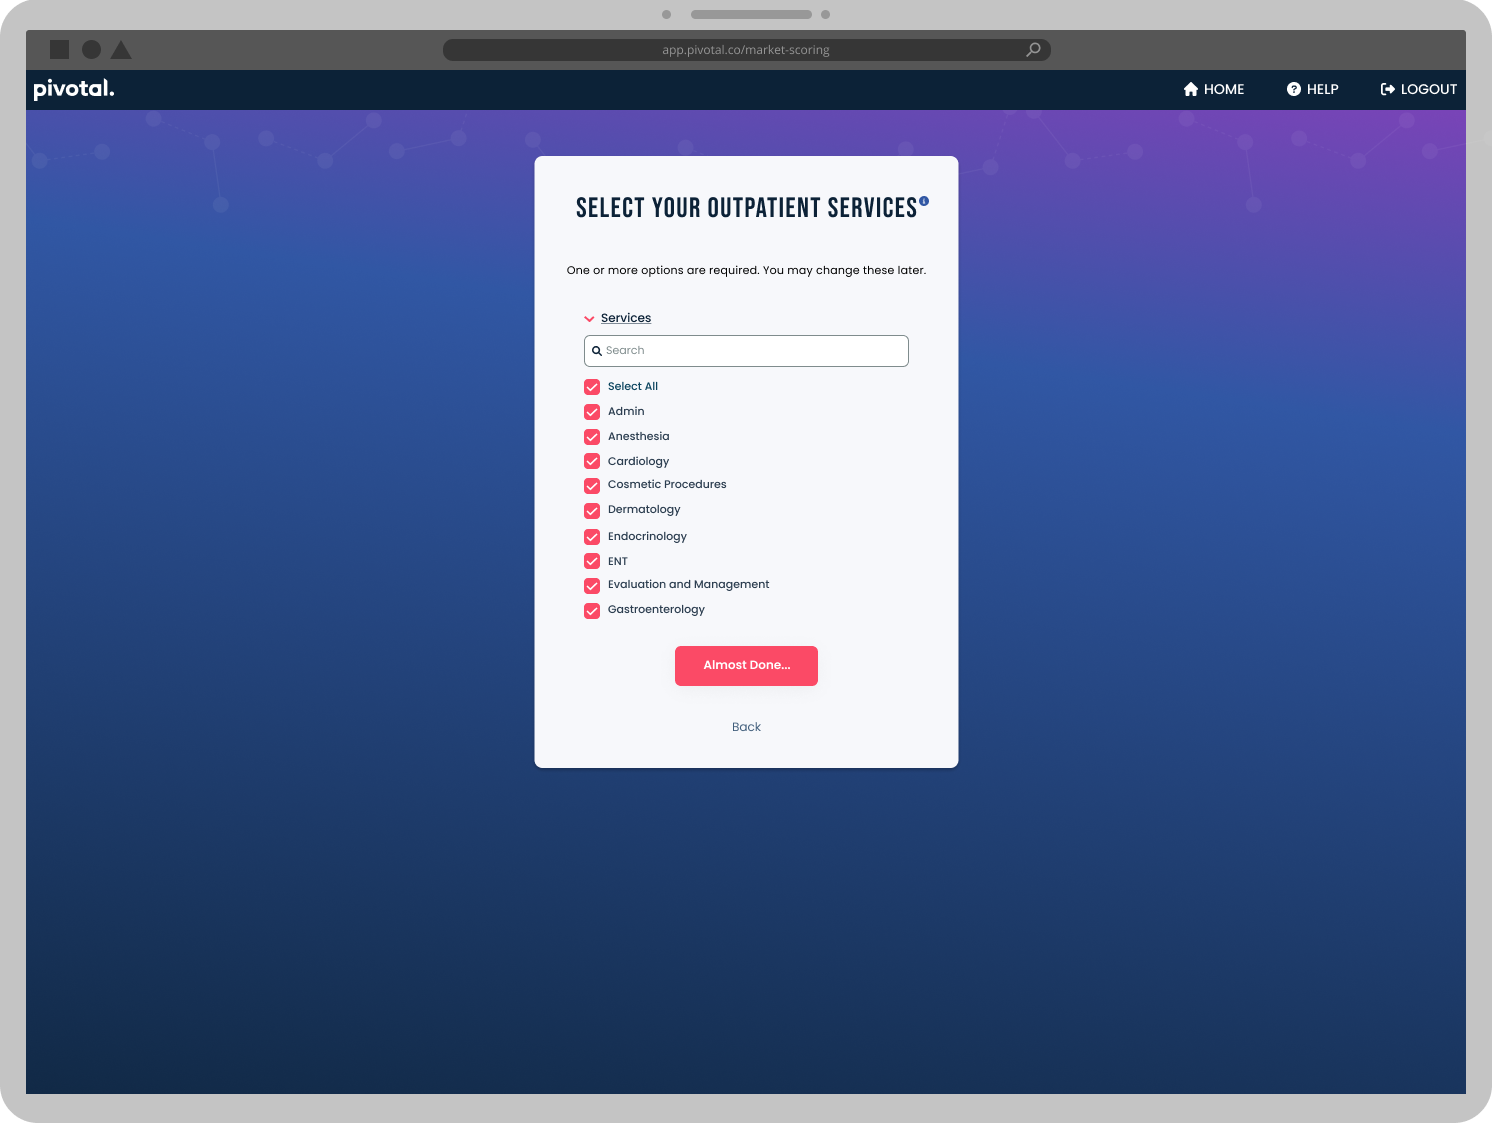
The next two steps in the initial set up of a project were selecting a region (via searchable dropdown for initial version), and then selecting services that were to be included in the opportunity calculations.

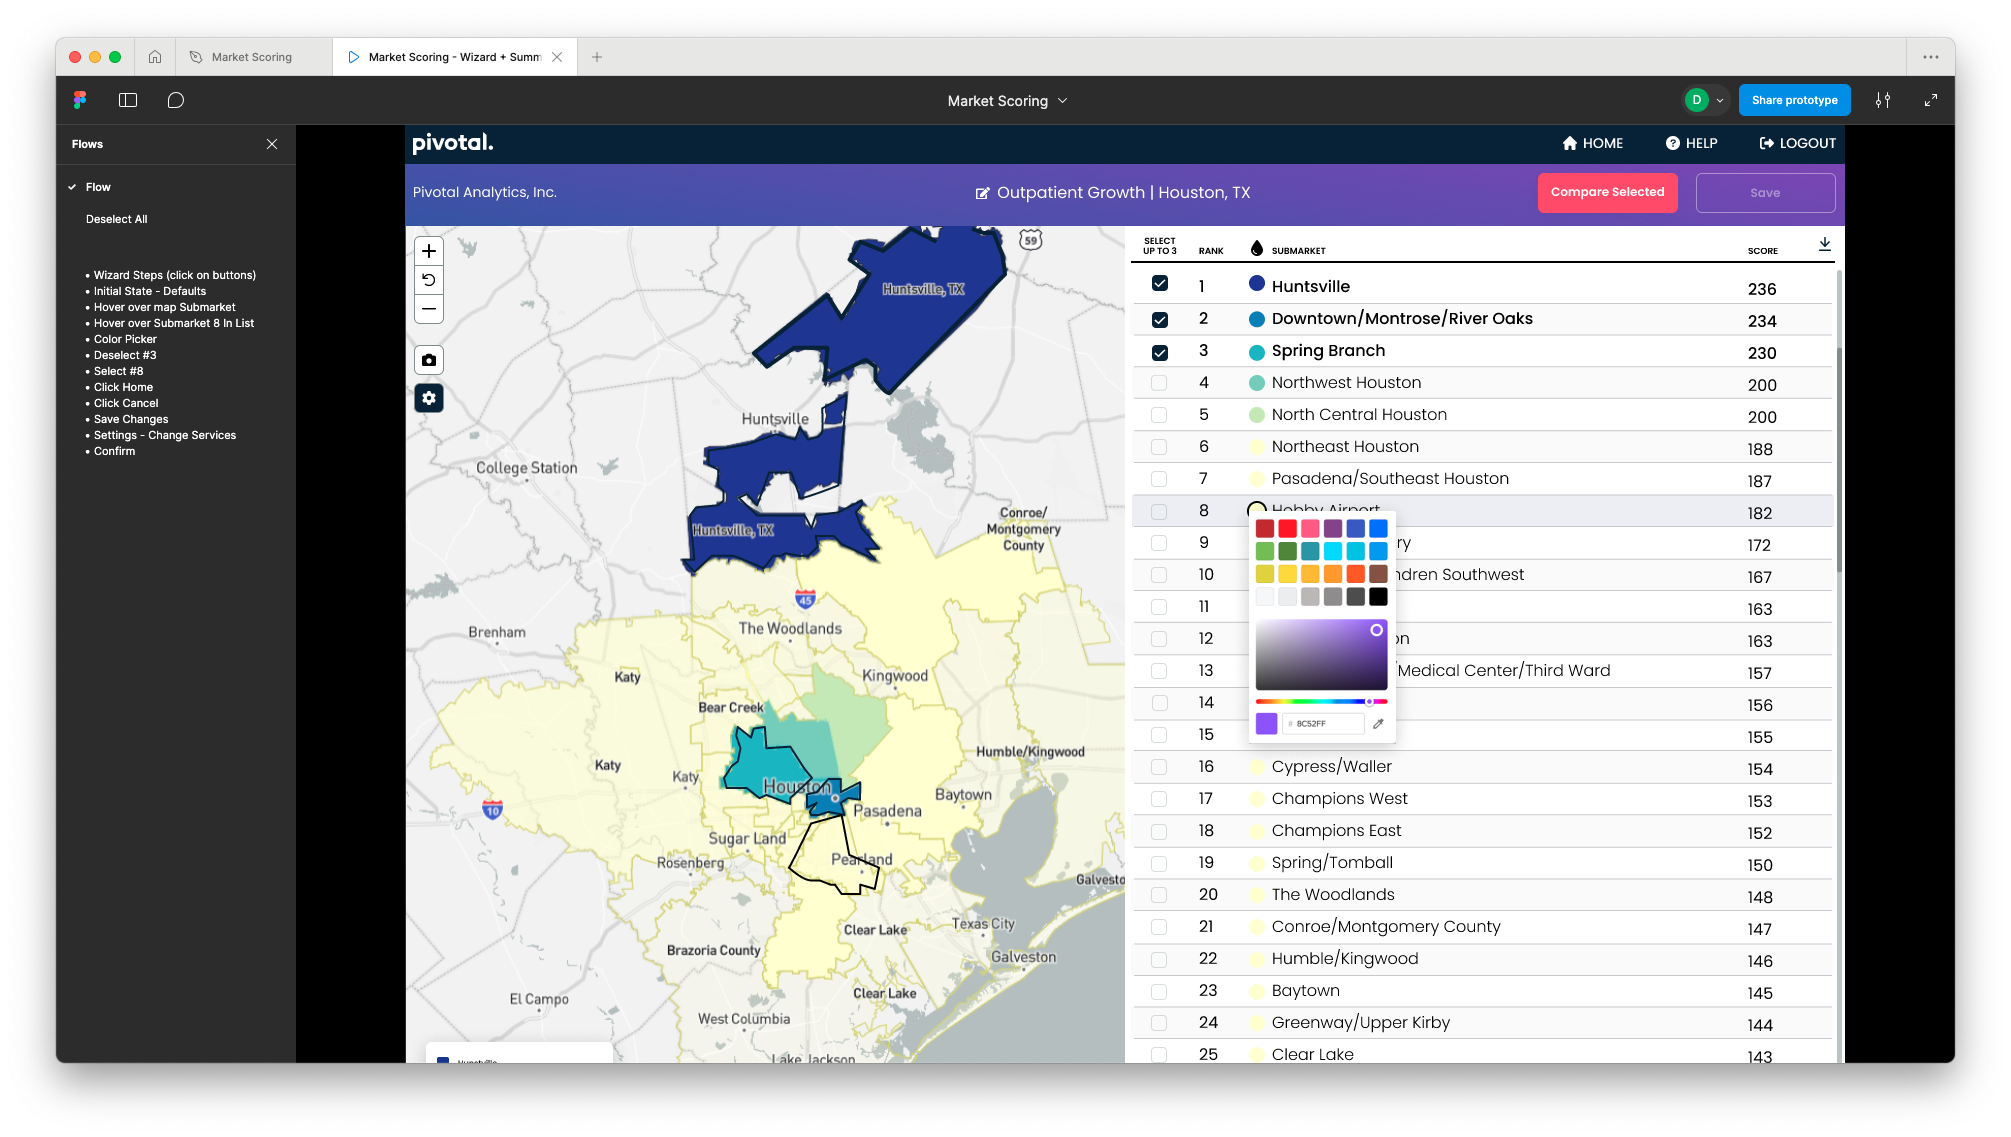

After user selects goal, region, and services, they land here with an easy-to-understand map and list view of submarkets.
Features for a useful, simple experience
A visual map helps users to spot areas of opportunity quickly. The map was designed to be useful and exportable immediately. They can also choose to edit colors of any submarket to highlight with brand colors for customer presentations, and highlight different areas around the top markets if they prefer.
The list of submarkets was organized by Rank based on criteria in their selected Goal and Selected Services. The score for each market provided a standard with which users could compare across other markets they scored, providing broader context.
Users could download details of the submarket list, which included information on how the goal and variables calculated the results.
Finally, users could use the default top 3 selected sub markets or change selected submarkets in order to import them into the market assessment tool for further opportunity analysis.
To hear more about this project, contact me directly.